Enhanced Graphs with Legends, Data Tables, and More
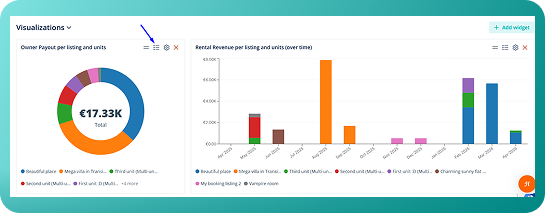
We're excited to announce updates to our Analytics graphs. By migrating to a more powerful library, we're introducing new features designed to provide a more user-friendly experience.
What's new:
-
Clear Listings Legends: Widgets that display data per listing now feature a persistent legend. This highly requested feature eliminates the need to hover over the graph to identify individual listing data.
-
Data Tables for Every Graph: Every graph widget is now accompanied by a data table. A new icon allows you to switch to a raw data view of the visuals.
-
Smoother Visuals: We've refined the rendering of our line charts, which now display with smoother, more elegant lines for a cleaner and more modern aesthetic.
-
Interactive Tooltips: To help you focus on the data that is most important to you, hovering over a specific category in the legends, such as a channel or listing, will now highlight the corresponding section of the graph.
Why it matters:
These enhancements are designed to make your analytics more intuitive and easier to interpret, enabling you to gain quicker insights from your data. This update is a step towards migrating the Analytics module to our new design system, including the much-anticipated ability to download Analytics reports.
How to use it:
These improvements are now live and available to all users with access to the Analytics page. Simply navigate to the Analytics section to see the updated graphs. Look for the new table icon on each graph to toggle between the visual chart and its corresponding data table.